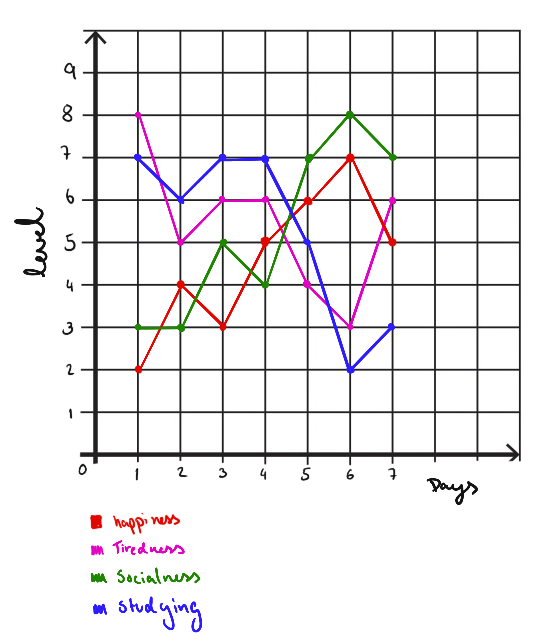
The main issue I was trying to address was how studying impacted my mood and personality. I decided that my studying had the greatest impact on pretty much every factor in my life, but I needed to determine which ones I specifically wanted to talk about. I determined how it impacted my social life, my tiredness and energy, and most importantly, my happiness. After collecting hte data for a week, I tried a couple different graphs, but determined that the plotted chart I used was the most effective graph to showcase what was clear to see. The more I studied, the less social and happy I was. Tiredness was impacted by both my social life and my studying, so that factor was the least important of three I wanted to look at.
In the future, if I were to continue this assessment, and wanted to see if there was a real correlation between my studying and my happiness, I would try different scenarios, maybe adjust the things I am studying, or change different variables. For the most part, I think this was pretty effective and I learned a lot about my priorities, and the places that I decided to put my energy. I think that I can work on different strategies to make studying a more engaging activity that I can be happy and feel a relief from.
